Basics of Python#
Python as a calculator#
Given the price \(p=27\) and quantity \(q=97\), determine the revenue \(r=pq\).
p=27
q=97
r=p*q
print("Revenue is", r)
Revenue is 2619
Suppose the cost of producing \(q\) units is \(c(q)=\dfrac{q^2}{10}\), determine the profits, \(pr=r-c(97)\)
c=(q**2)/10
pr=r-c
print("Profits equal", pr)
Profits equal 1678.1
An individual takes a loan of \(a=90000\) for \(t=5\) years at the rate of interest of \(r=10\) percent per annum compounded annually, determine the amount payable at maturity is \(f=a\left(1+\dfrac{r}{100}\right)^t\). Round it two decimal places.
a=90000
t=5
r=10
f=a*((1+(r/100))**t)
print("Amount payable is",round(f,2))
Amount payable is 144945.9
Is \(f > 145000\)?
print(f > 145000)
False
Is \(f=145000\)?
print(f==145000)
False
Is \(f\neq 145000\)?
print(f!=145000)
True
Is \(a<100000\) and \(f>145000\)?
print(a<100000 and f > 145000)
False
Is \(a<100000\) or \(f>145000\)?
print(a<100000 or f > 145000)
True
Conditionals#
Suppose you invest 100000 for 3 years. Rate of interest is 8% per annum compounded annually. If the amount recieved after 3 years exceeds 125000, print Good, else print Not Good.
a = 100000
r = 8
t = 3
f=a*((1+(r/100))**t)
if f > 125000:
    print("Good")
else:
    print("Not Good")
Good
print(f)
125971.20000000001
Loops#
Lists#
Dictionary#
Functions#
Define a function \(u_1(x,y) = \max(\min(x,2y), \min(2x, y))\) and print its value at \((2,4)\).
def u1(x,y):
    return max(min(x, 2*y), min(2*x, y))

print("u1(2,4) = " + str(u1(2,4)))
u1(2,4) = 4
Defining a utility function \(u_2(x, y) = \begin{cases} x+2y & \text{if } x \geq y\\ 2x+y & \text{if } x < y \end{cases} \) and finding the (approximate) demand for \(x\) and \(y\) as a function of \(p_x\), \(p_y\) and \(m\).
def u2(x,y):
    if x >= y:
        return x+2*y
    else:
        return 2*x+y


def approx_demand(u, px, py, m, epsilon = 10**(-3)):
    xstar, ystar = 0, m/py
    u_max = u(xstar, ystar)
    n_steps = int(m/(px*epsilon))
    x, y = 0, m/py
    for i in range(n_steps):
        if u(xstar, ystar) < u(x,y):
            xstar, ystar = x, y
            u_max = u(xstar, ystar)
        x = x + epsilon
        y = (m-px*x)/py
    return (xstar, ystar)

print("Demand is approximately equal to " + str(approx_demand(u2, 1, 4, 100)))
Demand is approximately equal to (99.99900000011343, 0.00024999997164343313)
Libraries#
Math#
Random#
Numpy#
Matplotlib#
Exercises:#
Use the approx_demand function above to perform the following tasks:
For \(u_3(x, y)= x + 2\sqrt{y}\), find the approx-demand for \(x\) and \(y\) when \(p_x=2\), \(p_y=1\) and \(m=1\).
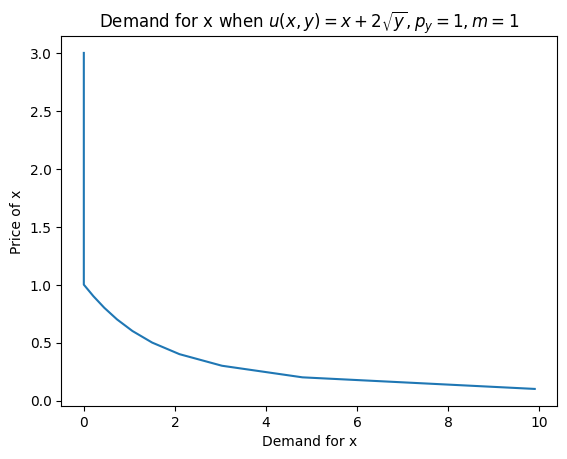
Create a dictionary where demand for \(x\) (using utility function \(u_3\)) is written as a function of \(p_x\), holding \(p_y=1\) and \(m=1\) as fixed. Keys are different prices of \(x\) from the set \(\{\frac{n}{10}: n\in\mathbb{N} \wedge n \leq 30\} = \{0.1, 0.2, 0.3, \ldots, 3.0\}\) and values are the corresponding demands for \(x\). We’ll use this data to sketch the demand curve.
For \(u_4(x, y)= \min(x, 2y)\), create a dictionary where demand for \(x\) is written as a function of \(m\), holding \(p_x=1\) and \(p_y=2\) as fixed. Keys are different incomes from the set \(\{\frac{n}{10}: n\in\mathbb{N} \wedge n \leq 50\} = \{0.1, 0.2, 0.3, \ldots, 5.0\}\) and values are the corresponding demands for \(x\). We’ll use this data to sketch the Engel curve.
For \(u_5(x, y)= x+2y\), create two lists: demand_x and xdemand_y. For different prices of \(x\) from the set \(\{\frac{n}{10}: n\in\mathbb{N} \wedge n \leq 50\} = \{0.1, 0.2, 0.3, \ldots, 5.0\}\), demand_x is the list of quantity of \(x\) demanded holding \(p_y=1\) and \(m=2\) as fixed. Similarly, for different prices of \(x\) from the set \(\{\frac{n}{10}: n\in\mathbb{N} \wedge n \leq 50\} = \{0.1, 0.2, 0.3, \ldots, 5.0\}\), xdemand_y is the list of quantity of \(y\) demanded holding \(p_y=1\) and \(m=2\) as fixed. We’ll use this data to sketch the price consumption curve.
def u3(x,y):
    return x + 2*(y**0.5)

print(approx_demand(u=u3, m=20, px = 2, py =1)[0])

d_x = {}
for i in range(1,31):
    px = i/10
    d_x[px] = approx_demand(u=u3, m=1, px = px, py =1)[0]
8.000000000001005
import matplotlib.pyplot as plt

price_of_x = list(d_x.keys())
demand_for_x = list(d_x.values())

plt.plot(demand_for_x, price_of_x)
plt.xlabel("Demand for x")
plt.ylabel("Price of x")
plt.title("Demand for x when " + r"$u(x,y) = x+2\sqrt{y}, p_y = 1, m = 1$")
plt.show()
from IPython.display import HTML
# Youtube
HTML('<iframe width="560" height="315" src="https://www.youtube.com/embed/knuRpnp2AS8?rel=0&controls=0&showinfo=0" frameborder="0" allowfullscreen></iframe>')
/usr/share/miniconda3/envs/econschool-notebook/lib/python3.8/site-packages/IPython/core/display.py:431: UserWarning: Consider using IPython.display.IFrame instead
  warnings.warn("Consider using IPython.display.IFrame instead")
HTML('<iframe width="560" height="315" src="https://www.youtube.com/embed/wrP_ivo6cXc?rel=0&controls=0&showinfo=0" frameborder="0" allowfullscreen></iframe>')
HTML('<iframe width="560" height="315" src="https://www.youtube.com/embed/FoLwXiO2eeo?rel=0&controls=0&showinfo=0" frameborder="0" allowfullscreen></iframe>')
HTML('<iframe width="560" height="315" src="https://www.youtube.com/embed/AOsfKJZFwvI?rel=0&controls=0&showinfo=0" frameborder="0" allowfullscreen></iframe>')